VisualLab is syntax free new generation math software, making computations of mathematics easier than
ever! Freely write equations as in a notebook; VisualLab knows how to compute. It is visual;
you'll instantly know how to use it; no training is needed. Making one abler and more efficient,
and ideal for engineers, scientists, teachers and students VisualLab covers most math needs in science, engineering
and statistics, e.g:
Linear equations & Matrices;Nonlinear equations;Calculus;
Probability and Statistics;Equation solving;
Differential equations;
Transcendental equations;Equation plotting;
Curve fitting;
Graph digitizing;
Gel digitizing;Finance calculators;
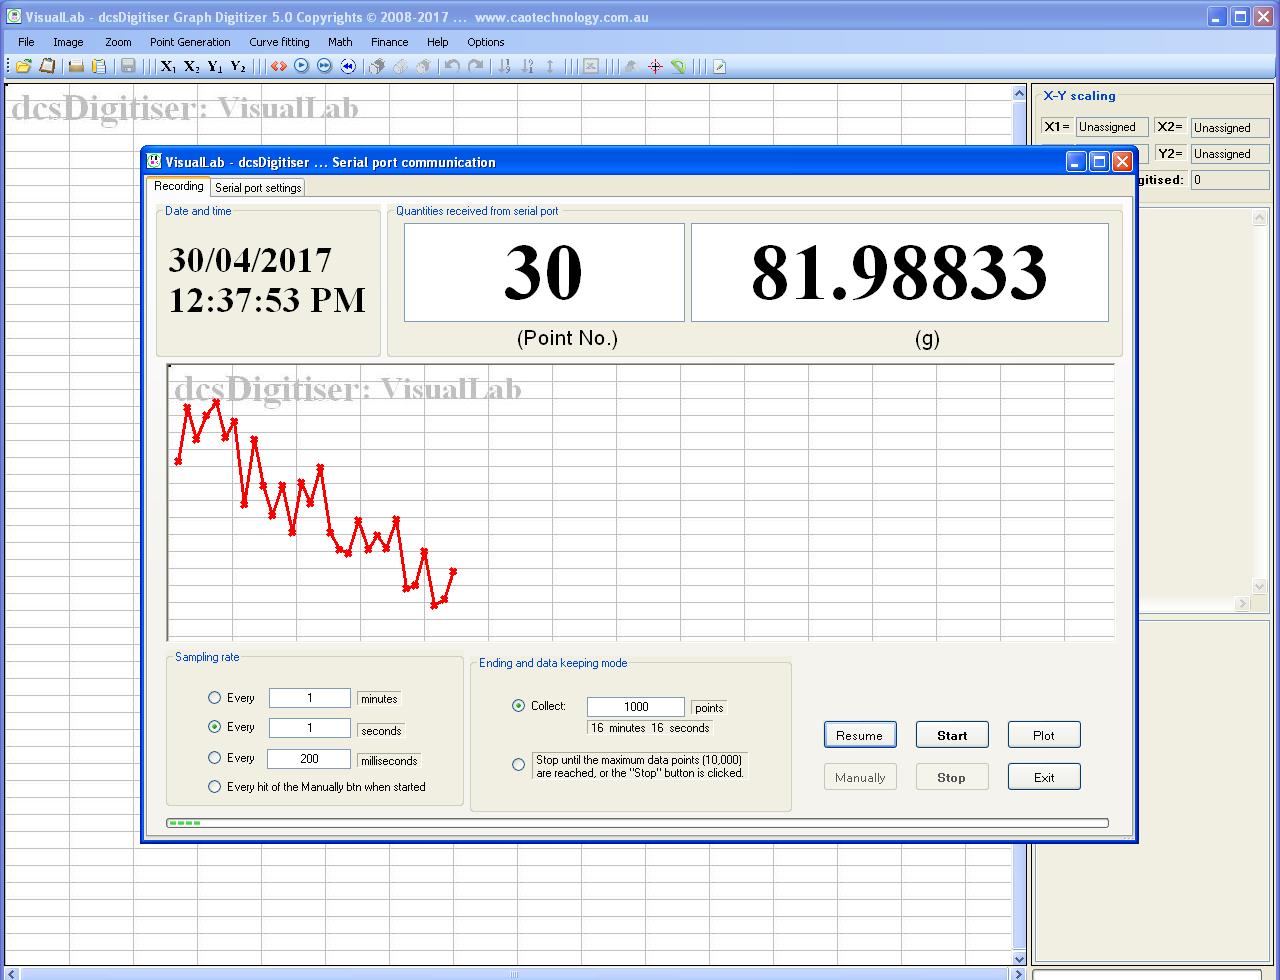
Serial communication;FFT
more and more...

![]() click to download a PDF post of VisualLab.
click to download a PDF post of VisualLab.
To have a free trial of VisualLab, simply click Free trial
Splash screen of VisualLab
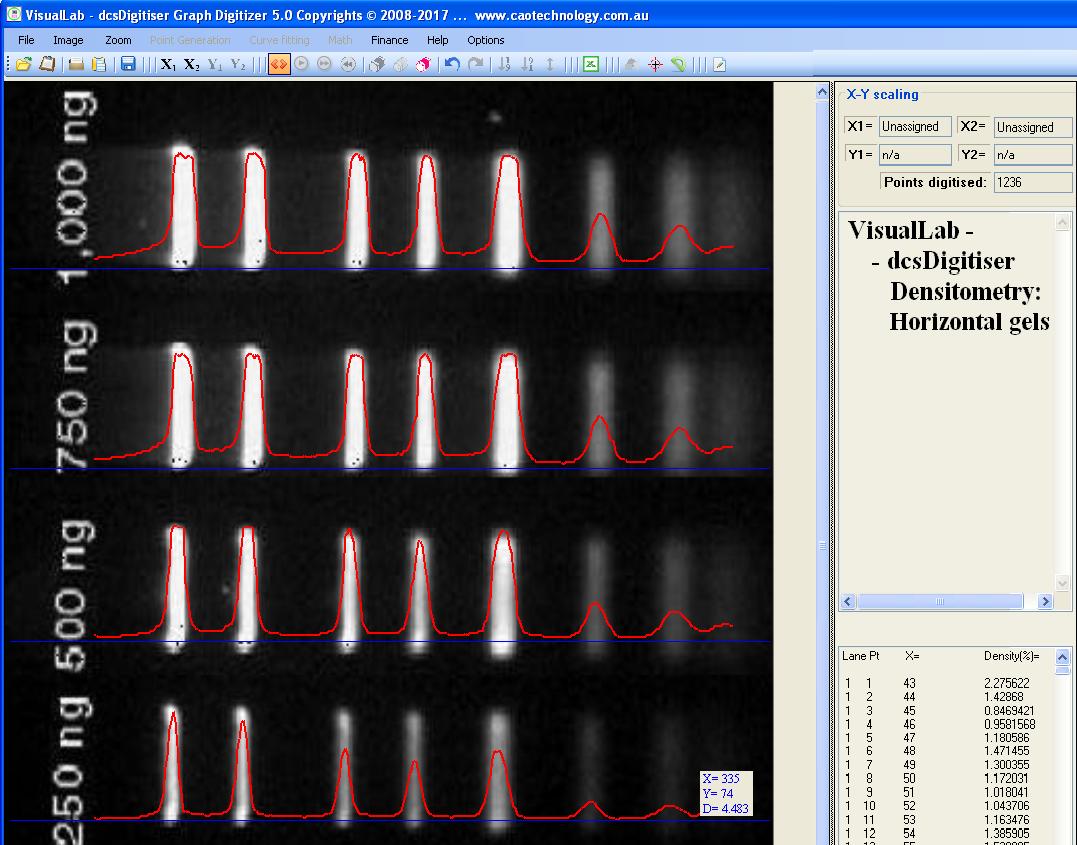
A gel is digitized, and intensity profiles are plotted
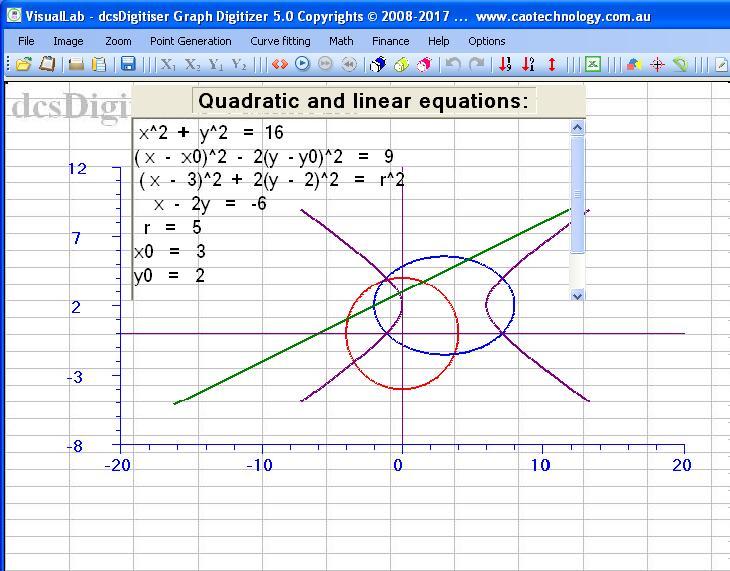
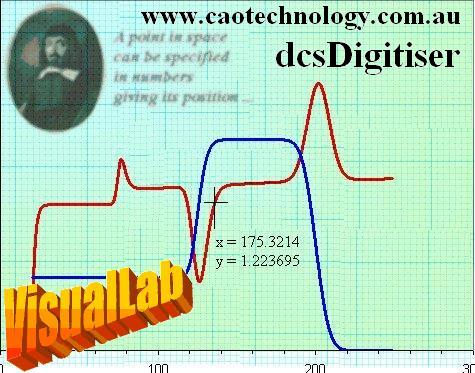
Type in quadratic equations, curves are plotted
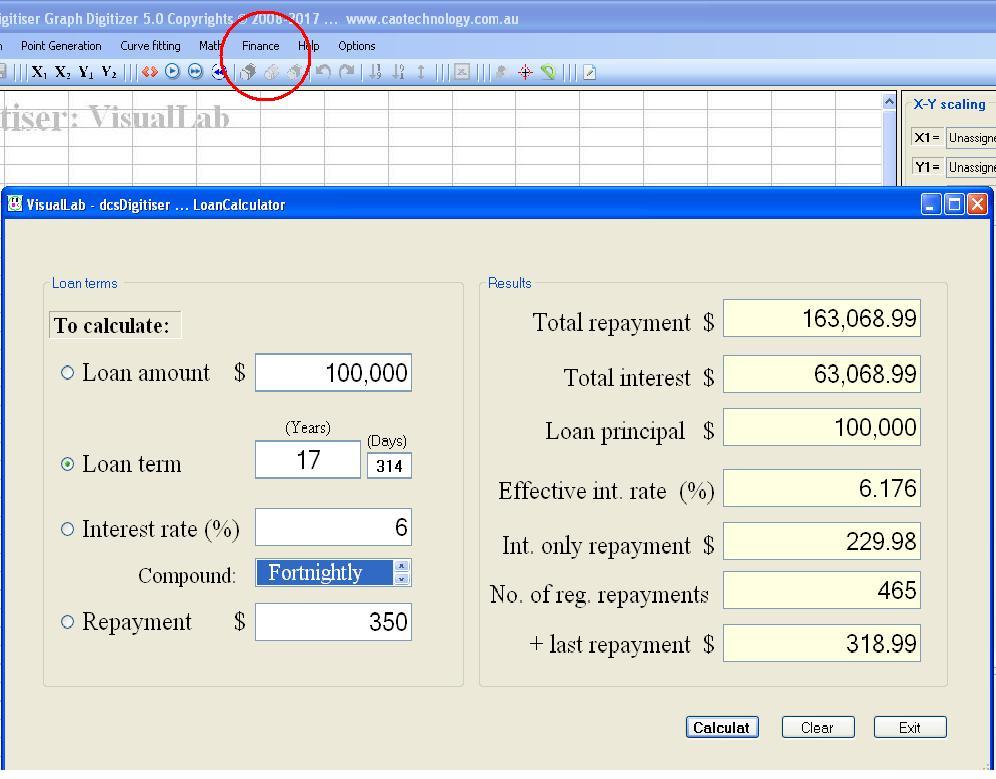
VisualLab..Finance..Loan calculator enables calculations of various loan terms. Simply a click
Some additional utilities of VisualLab. To have a free trial of VisualLab, simply click Free trial
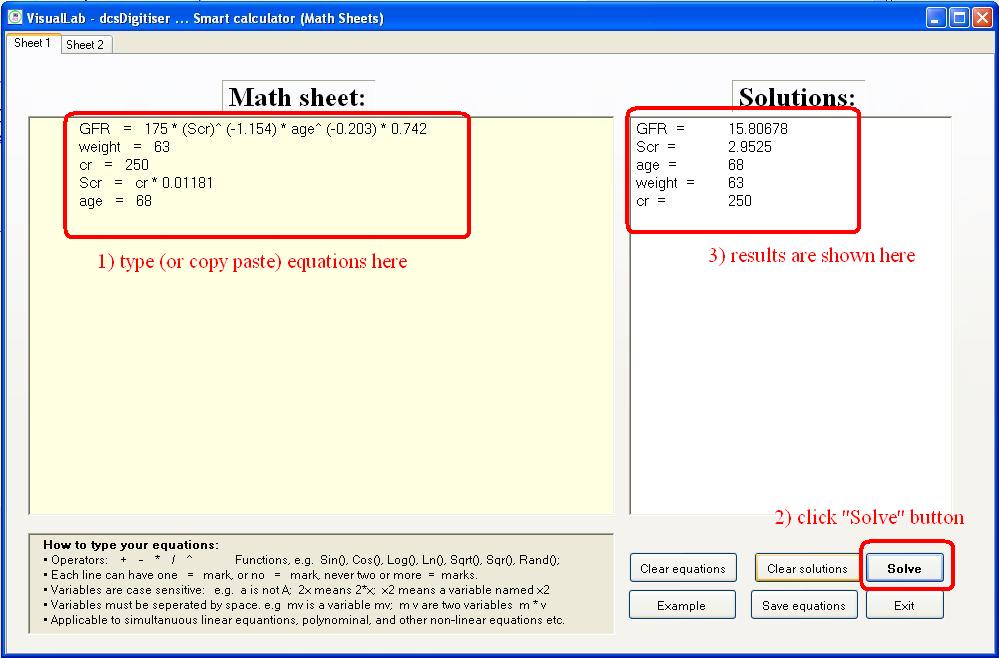
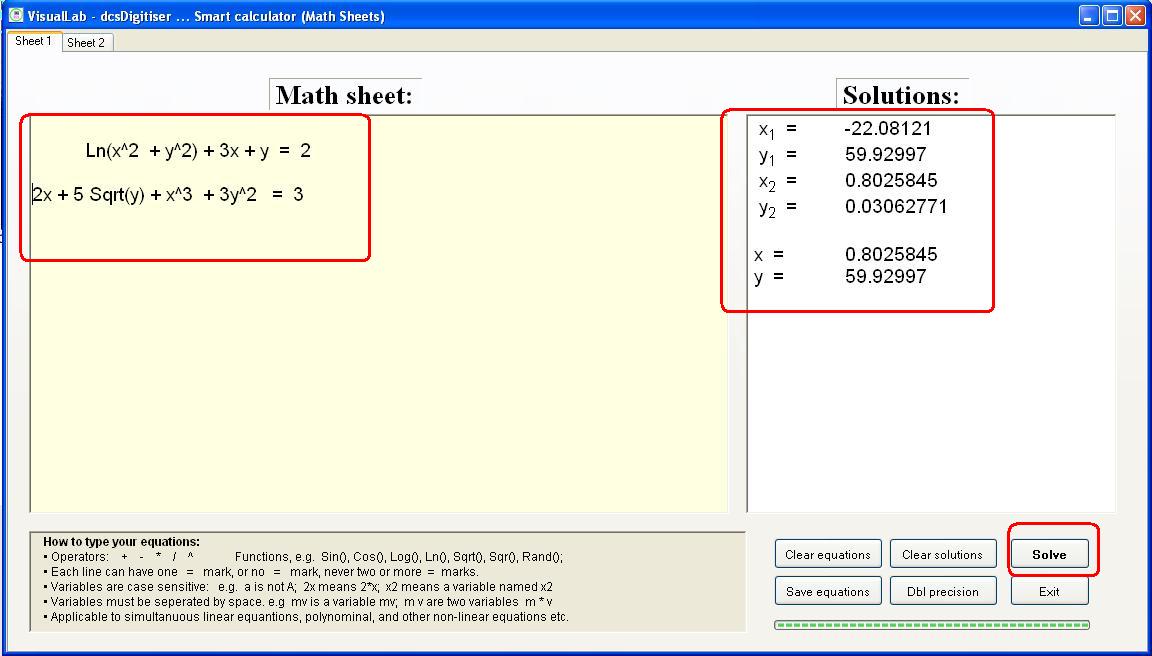
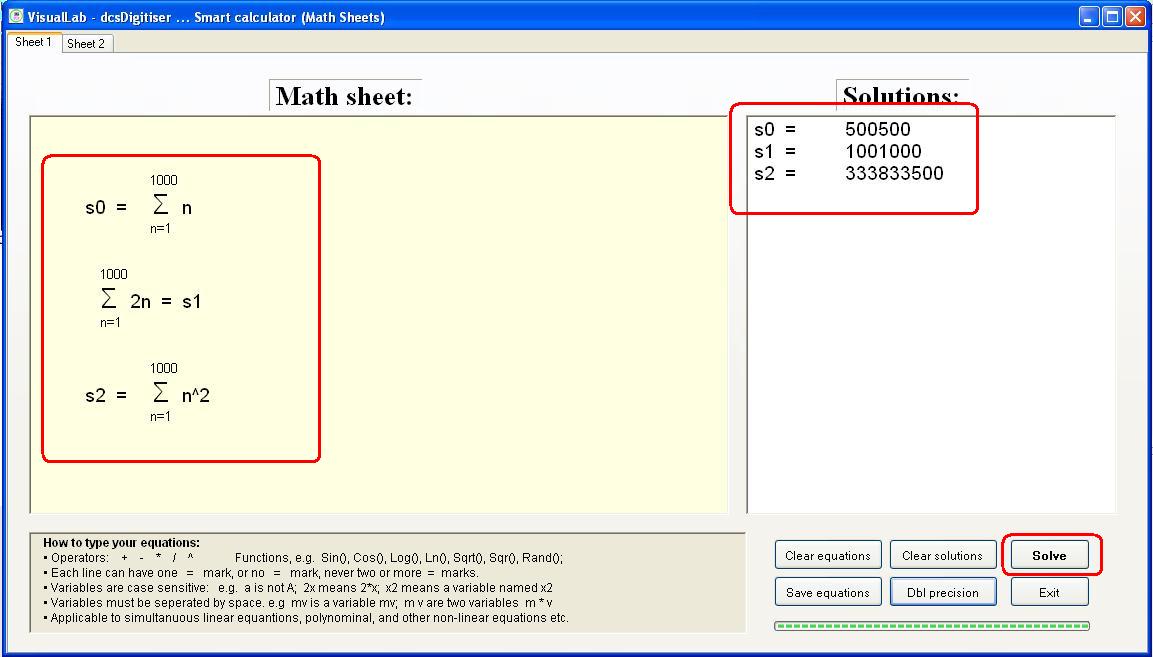
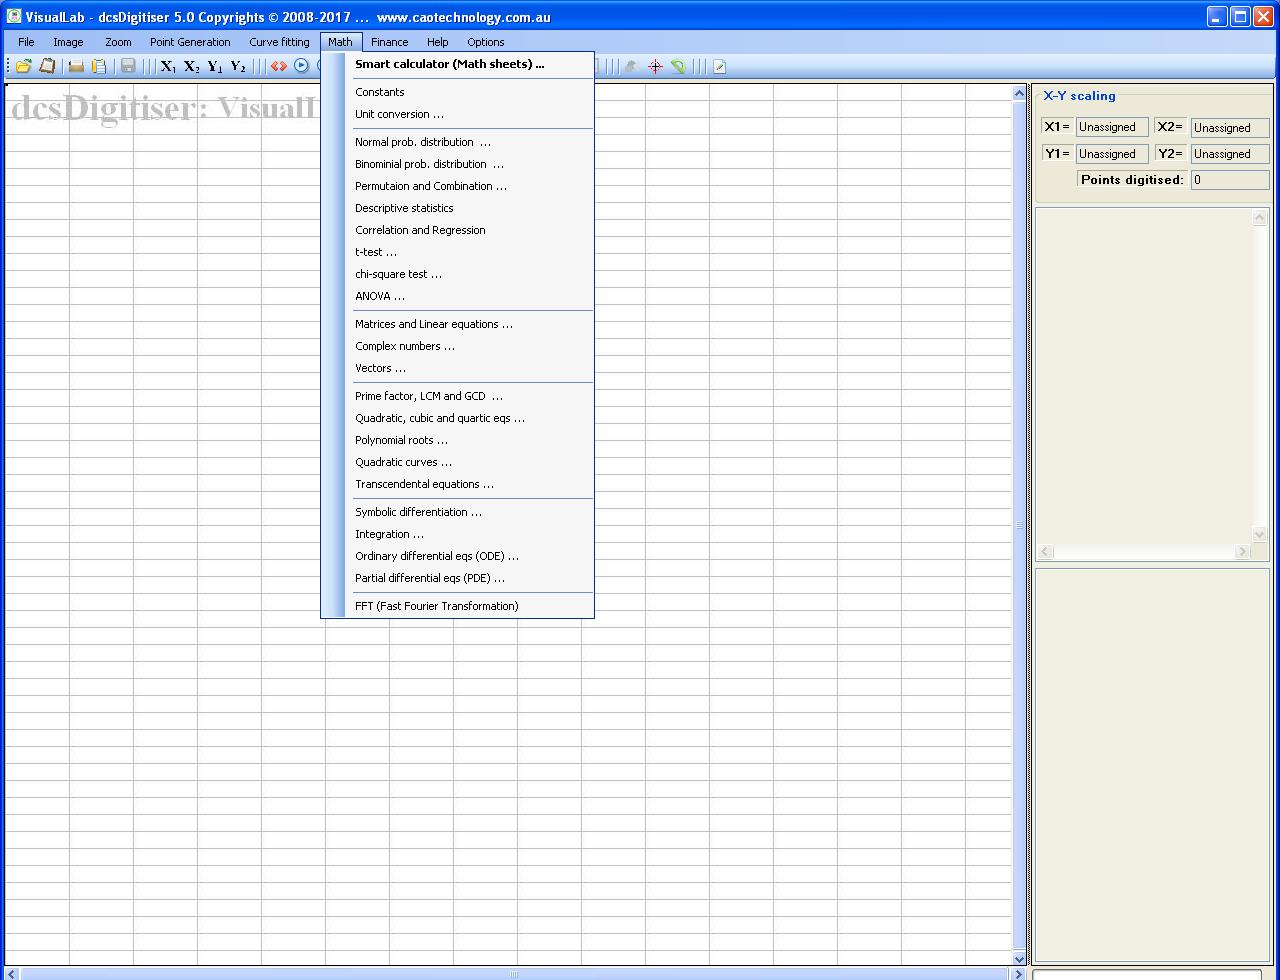
Syntax-free computation (Format-free computation)
Syntax-free (or format-free) math computation is a novel software technology that allows users to input equations as in a notebook free of computational syntax; the software program interprets what equation inputs are, and works out how to complete computations for these equations. No variable declaration, no command is needed. This will not only produce prompt solutions, but also release the strain on user's thinking brain from switching on and switching off between the domain of computational syntax and the domain of math issues themself, making the user abler and more efficient. Syntax free computation is a unique feature of VisualLab.
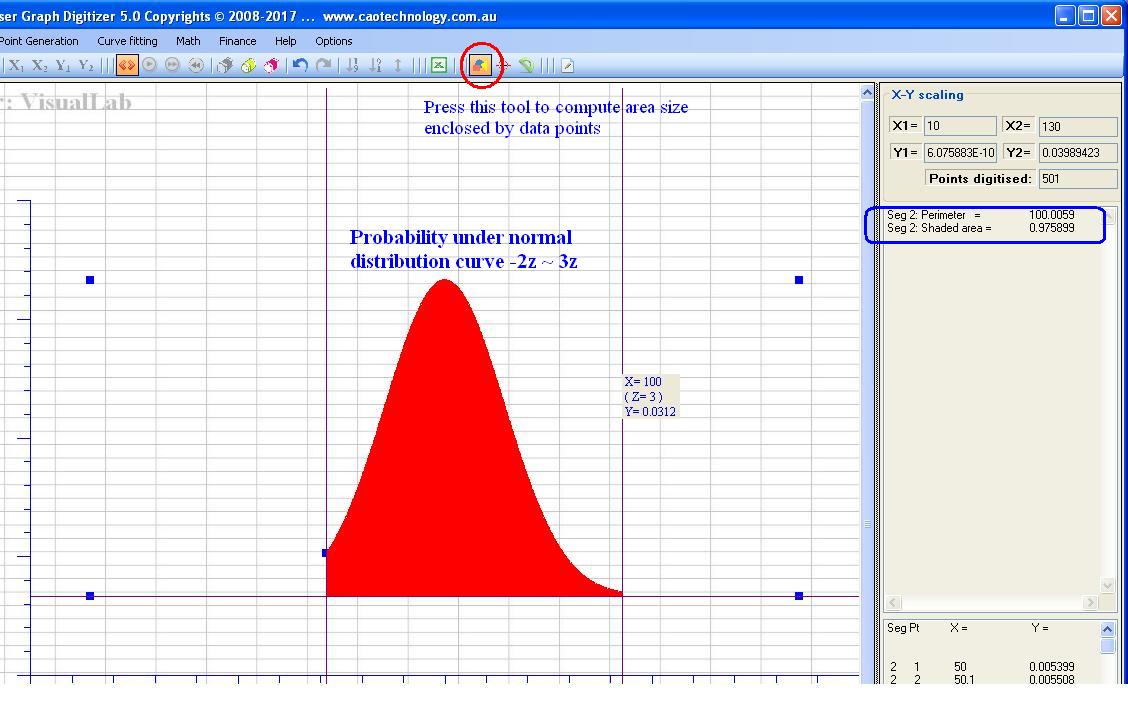
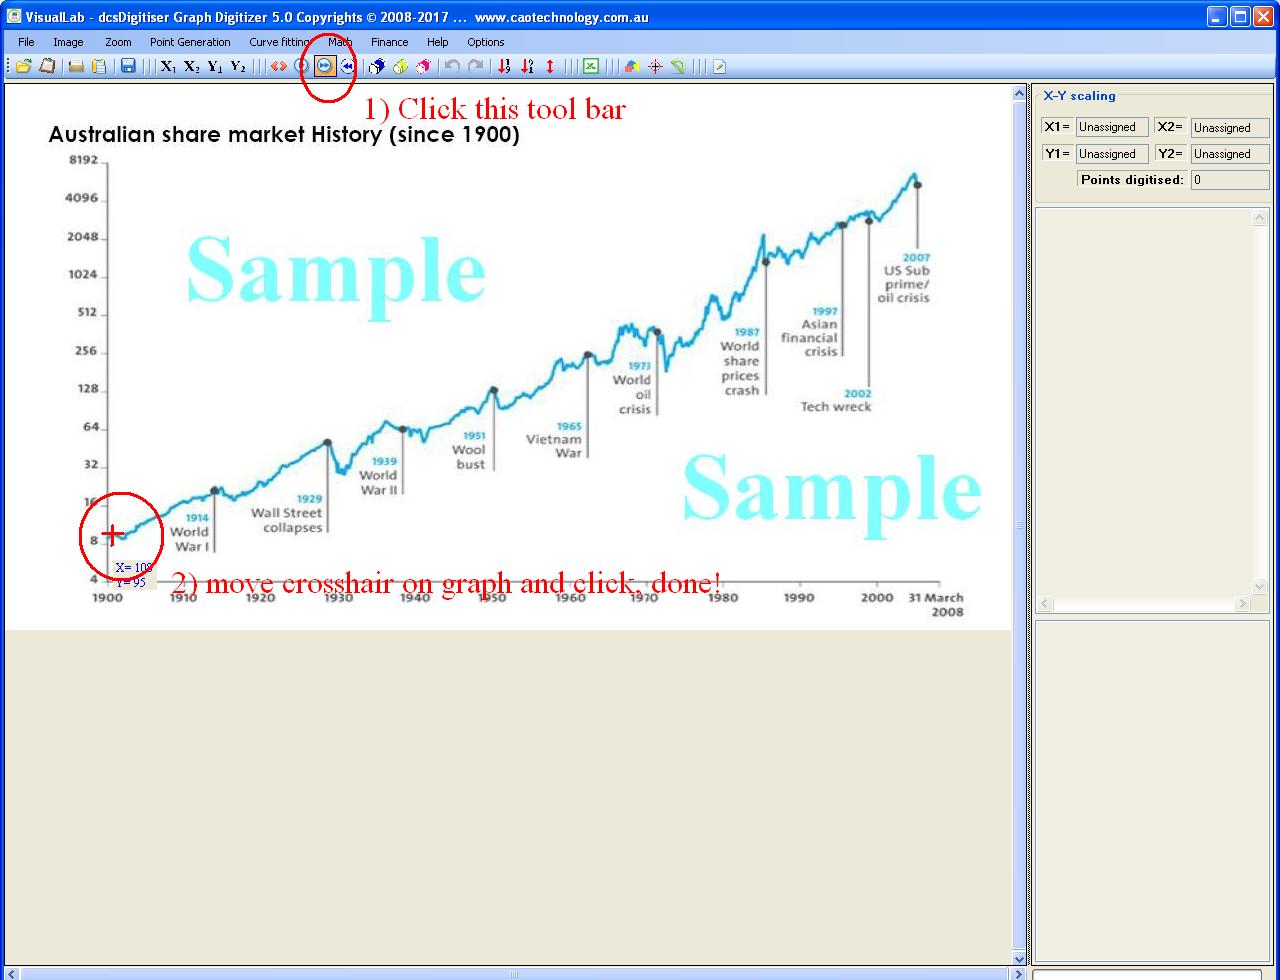
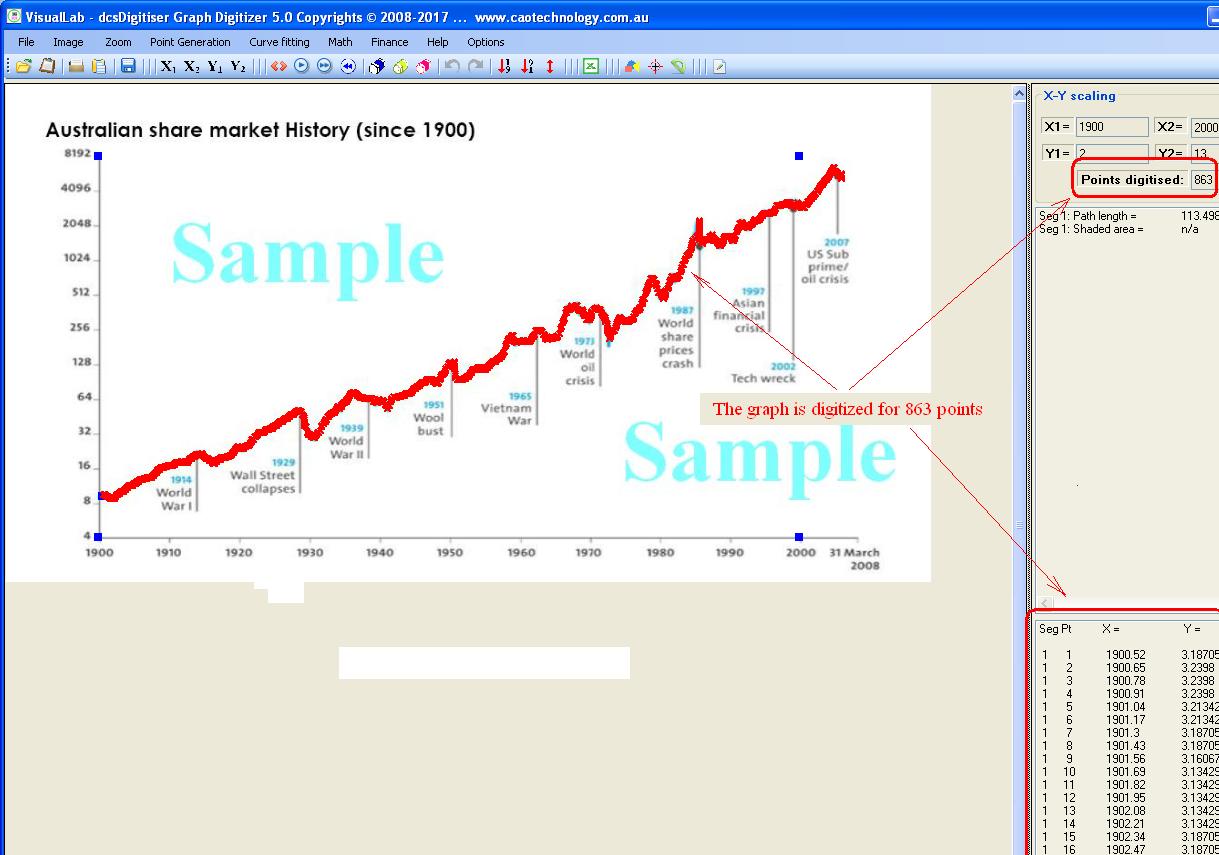
Graph digitizing
Graph digitizing, aka plot digitizing, curve digitizing is a software technology that reads the graph shown in a figure/picture, converts it to x-y numbers so that mathematical analyses can be carried out for the graph. Note that figure/picture is actually already in a digital form; graph digitizer is actually a software tool for recognizition of graphs (curves plots) in the figure/picture, convert it to digital X-Y numbers. Conveniently and automatically digitizing graph (curve plot) is another unique feature of VisualLab.
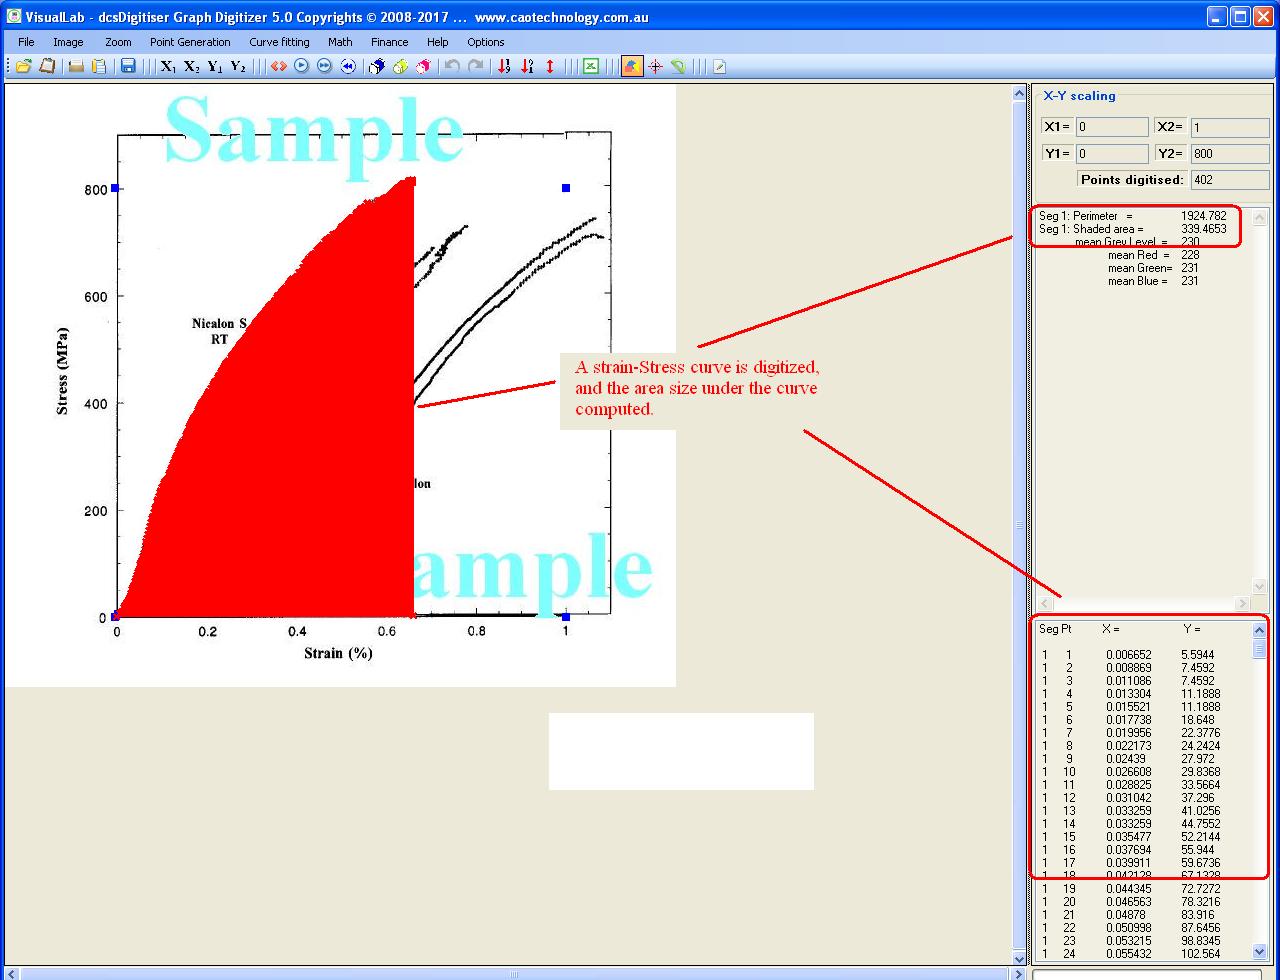
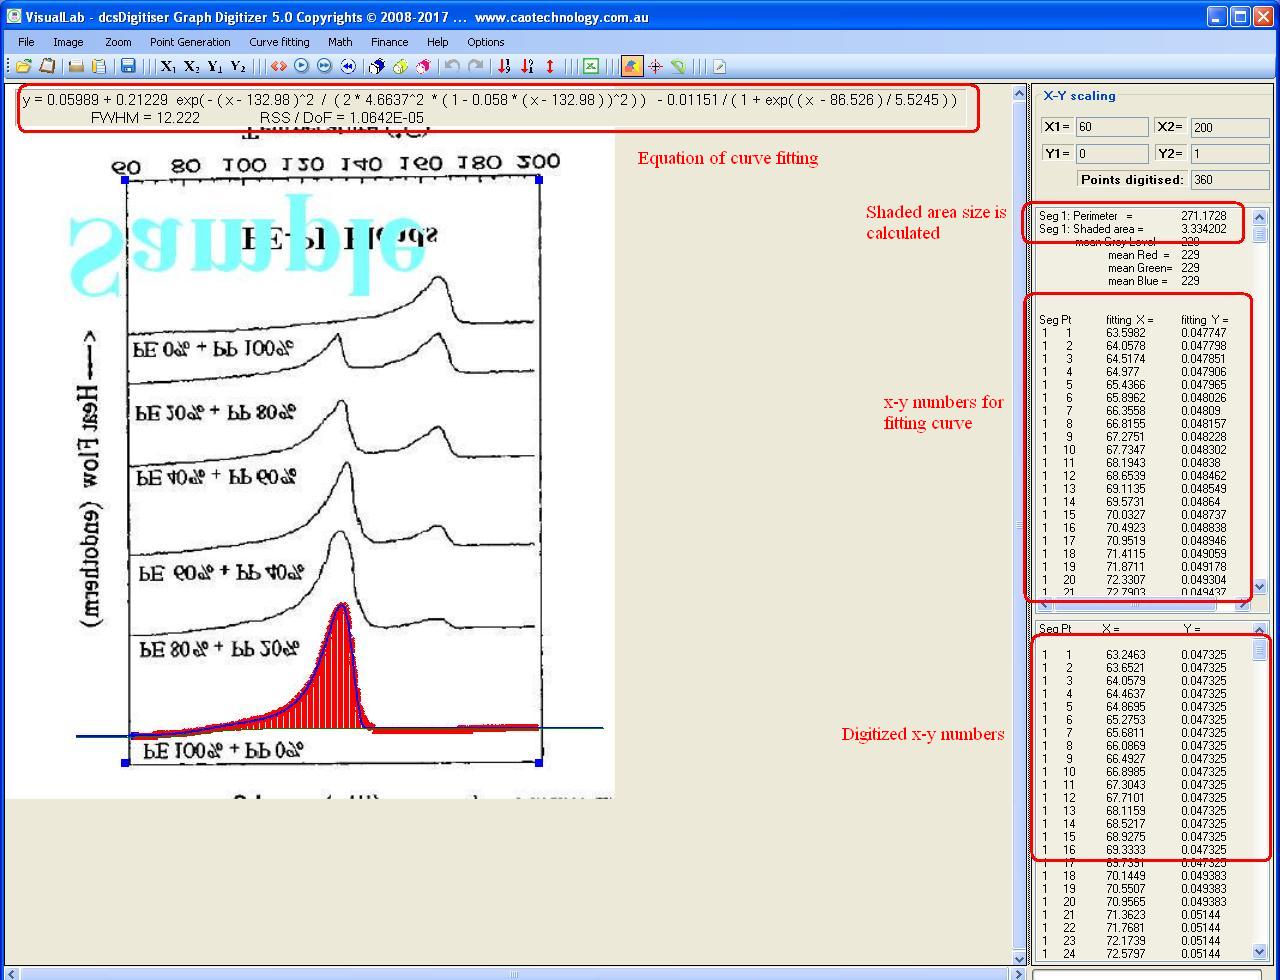
Area size computation
Area size computation refers computation of area size enclosed by any select set of points. One can freely define and select data set consisting of no less than 3 points, its enclosed area size is then computed. This functionality is particularly useful to e.g. curve analysis in analytical chemistry, calculation of maps or drawings. VisualLab enables users freely define select point set and computer its enclosed area size by a single click.
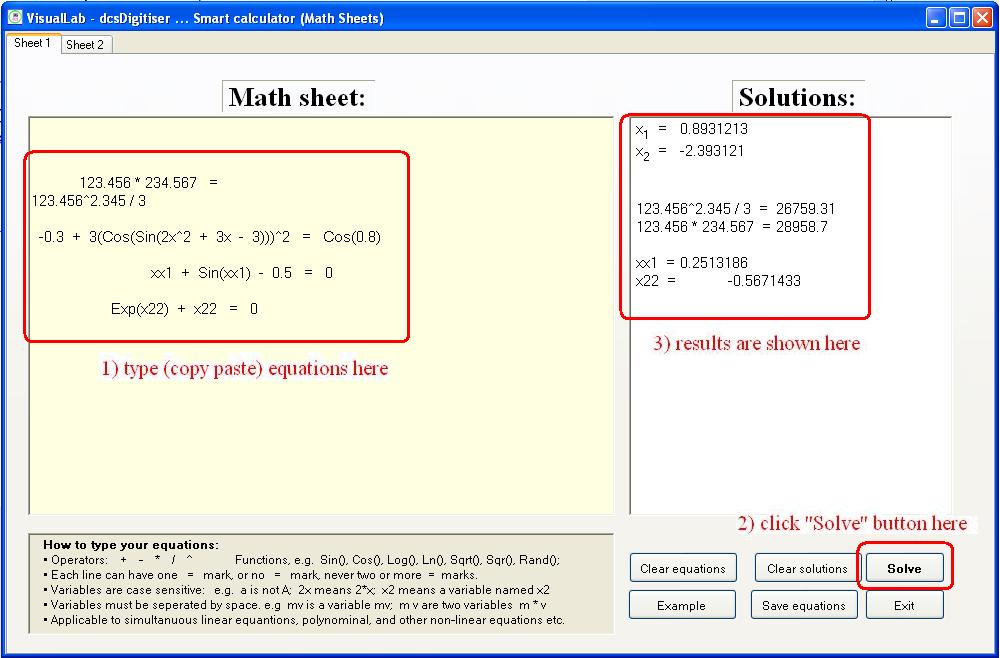
Formula calculator / formula evaluator:
A formula calculator, aka expression calculator, formula evaluator, is a calculator that can perform calculations for a math formula or expression by a single button action to obtain final results.
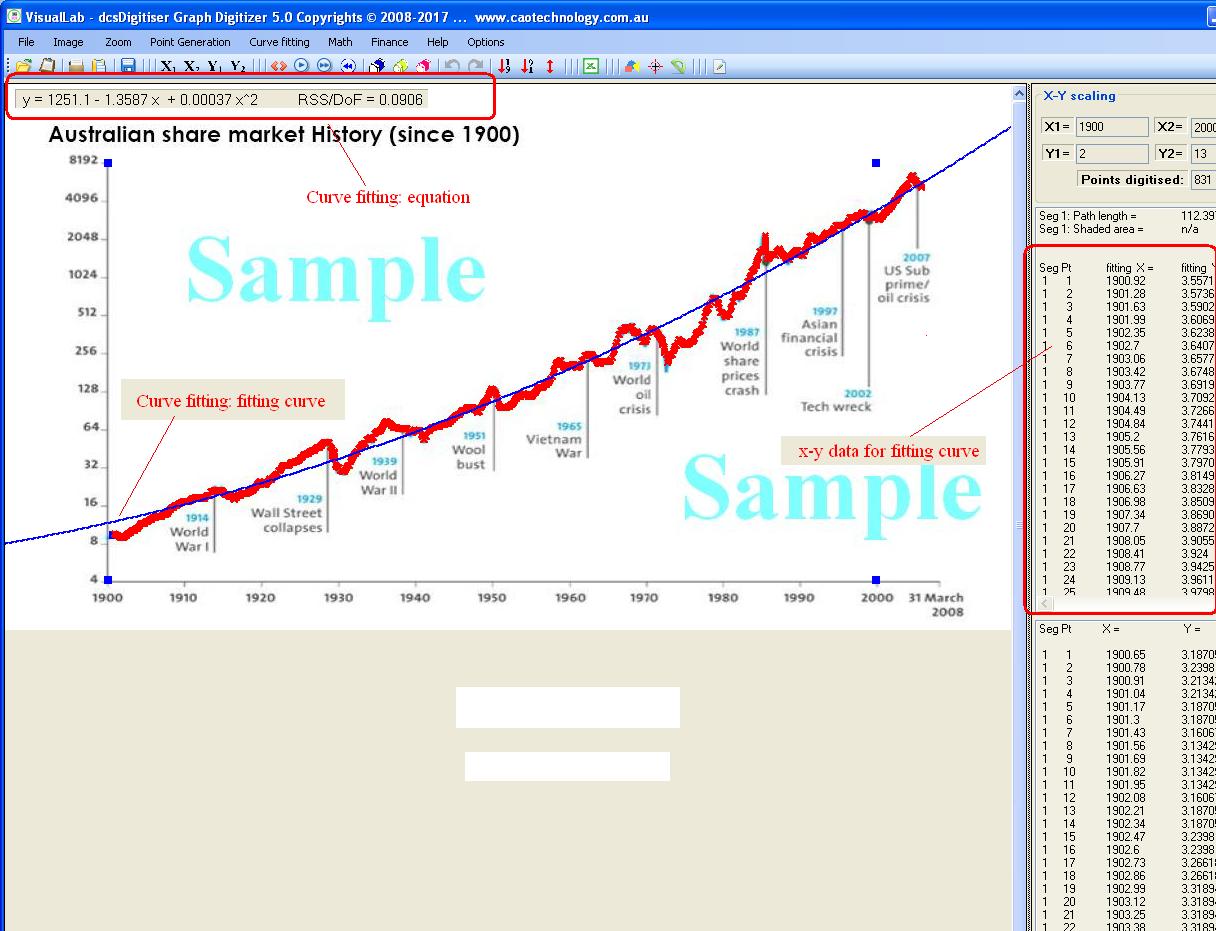
Curve fitting:
Curve fitting is a process of constructing a mathematical function, which has the best fit to the curve consisting of a series of data points.
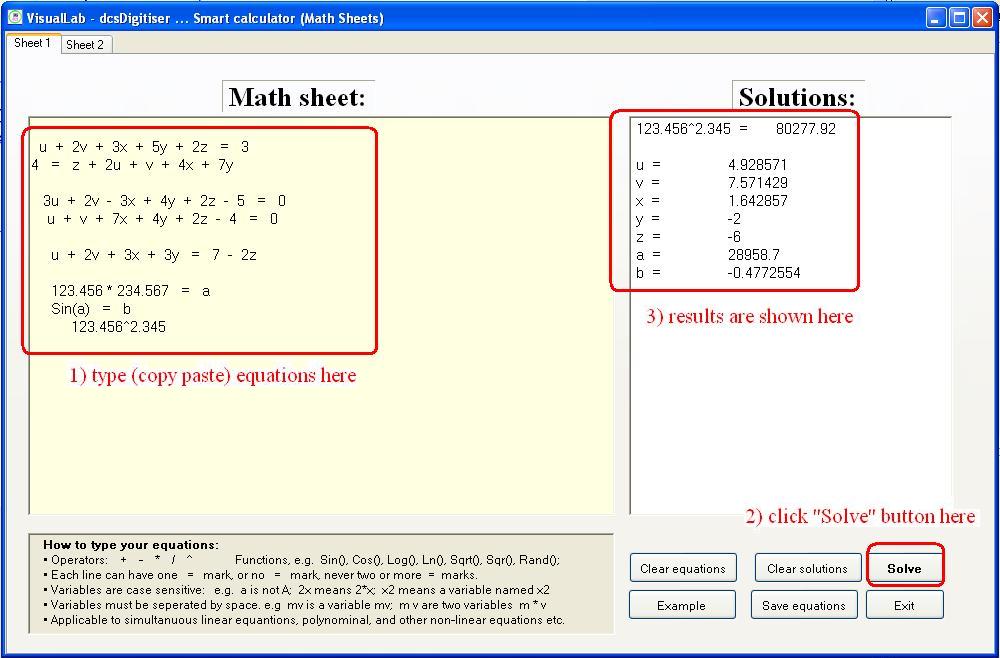
Linear equations:
Linear equations are algebraic equations in which each term is either a constant or the product of a constant and a single variable. Simultaneous linear equations are a set of two or more linear equations, each containing two or more variables whose values simultaneously satisfy all the equations in the set, with number of variables being equal to or less than the number of equations in the set.
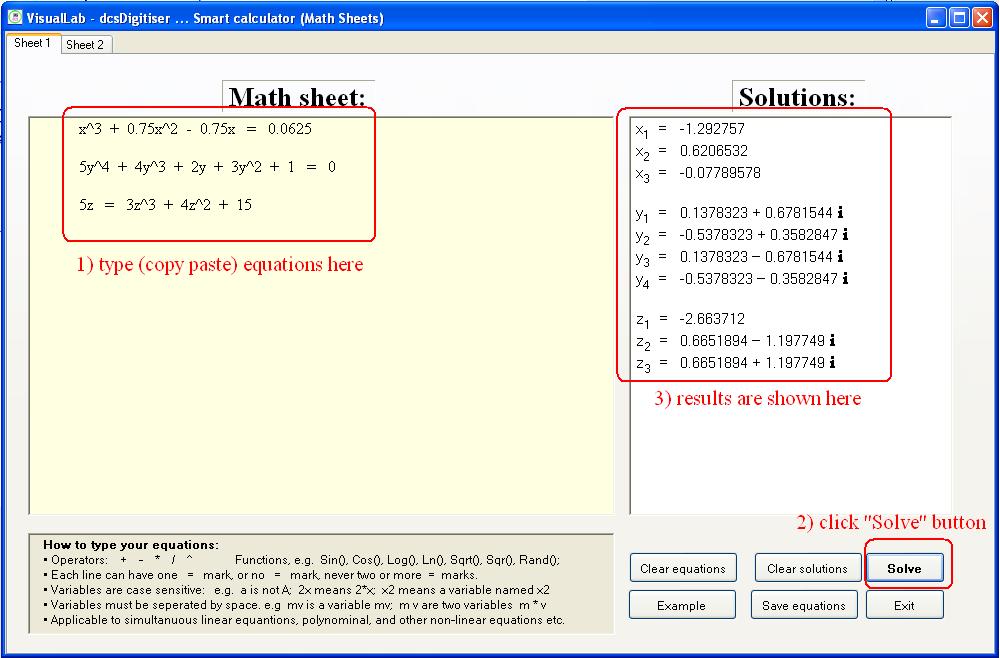
Non-linear equations:
Nonlinear equations, a.k.a. nonlinear system, are algebraic equations that are not linear equations. Simultaneous nonlinear equations are a set of equations in which at lerast one of them is nonlinear equation. Typical example of nonlinear equations is a polynomial of degree higher than one.
Polynomial:
A polynomial is an expression consisting of variables and coefficients, that involves only the operations of addition, subtraction, multiplication, and non-negative integer exponents of variables. Examples of polynomial include quadratic equations.
Transcendental equations:
A transcendental function is an analytic function, in which its variable cannot be expressed in terms of a finite sequence of the algebraic operations of addition, multiplication, and root extraction.
Normal distribution:
A normal (or Gaussian or Gauss or Laplace Gauss) distribution is a bell shaped continuous probability distribution for a real-valued random variable.
Binomial distribution:
A binomial distribution is a discrete probability distribution. For any boolean valued outcomes, if probability, p, represents the probability of positive outcome, q = 1 - p would be the probability of negative outcome. Its probability mass function describes the probability of getting exactly k positives in n independent Bernoulli trials.
t-test:
A t-test, also known as Students t-test, is a test to determine if the difference between the means of two groups is statistically significant, or to determine if the mean of a group is statistically significant from a given value.
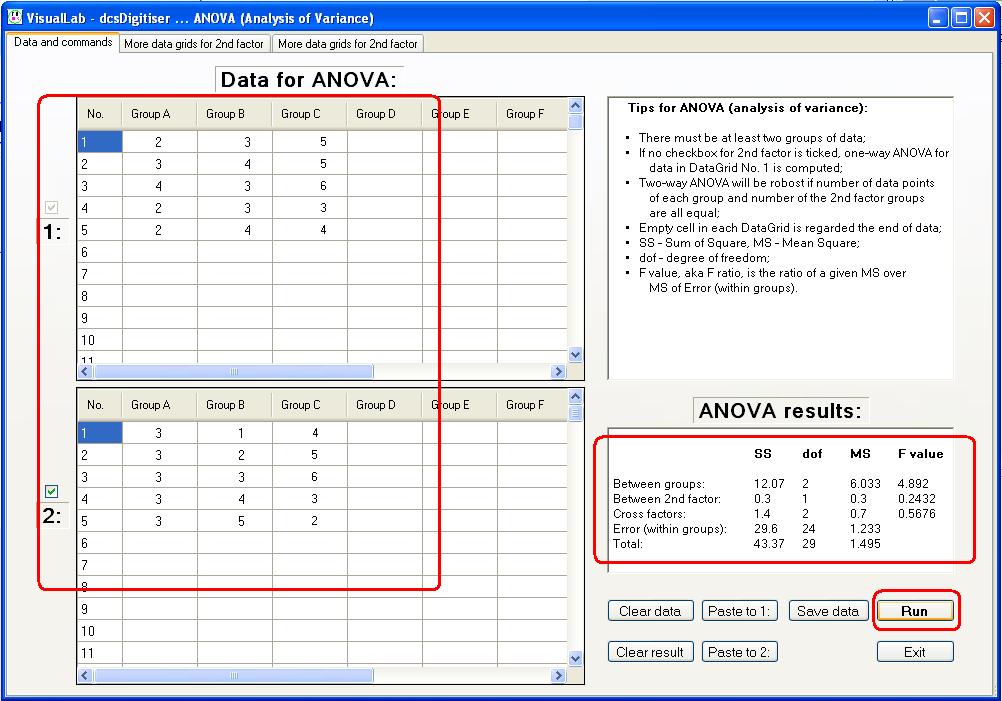
ANOVA:
ANOVA (analysis of variance) is a technique in statistics. It is used to analyse the variation among and between groups to check if the means of two or more groups are significantly different from each other.
To visit DSC Curve Solutions (DCS ®) and non-isothemal kinetics, click links shown in naviation bar.