Two simple steps to digitize a graph
Hundreds data points are automatically digitized in a second.
1) Click this button
2) move crosshair on graph and click, done!
VisualLab is not only a powerful software product for mathematics computations, it is also a powerful graph
digitizing tool. This web page shows some examples of VisualLab's applications for graph digitizing and gel digitizing.
More information about "How to digitize graphs" can be found in:
![]()
A free trial can be carried out instantly for free by clicking the naviation bar on the top "Free Trial / Order".
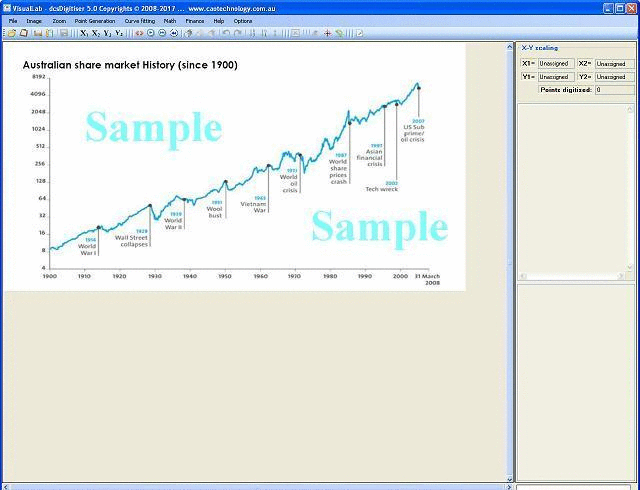
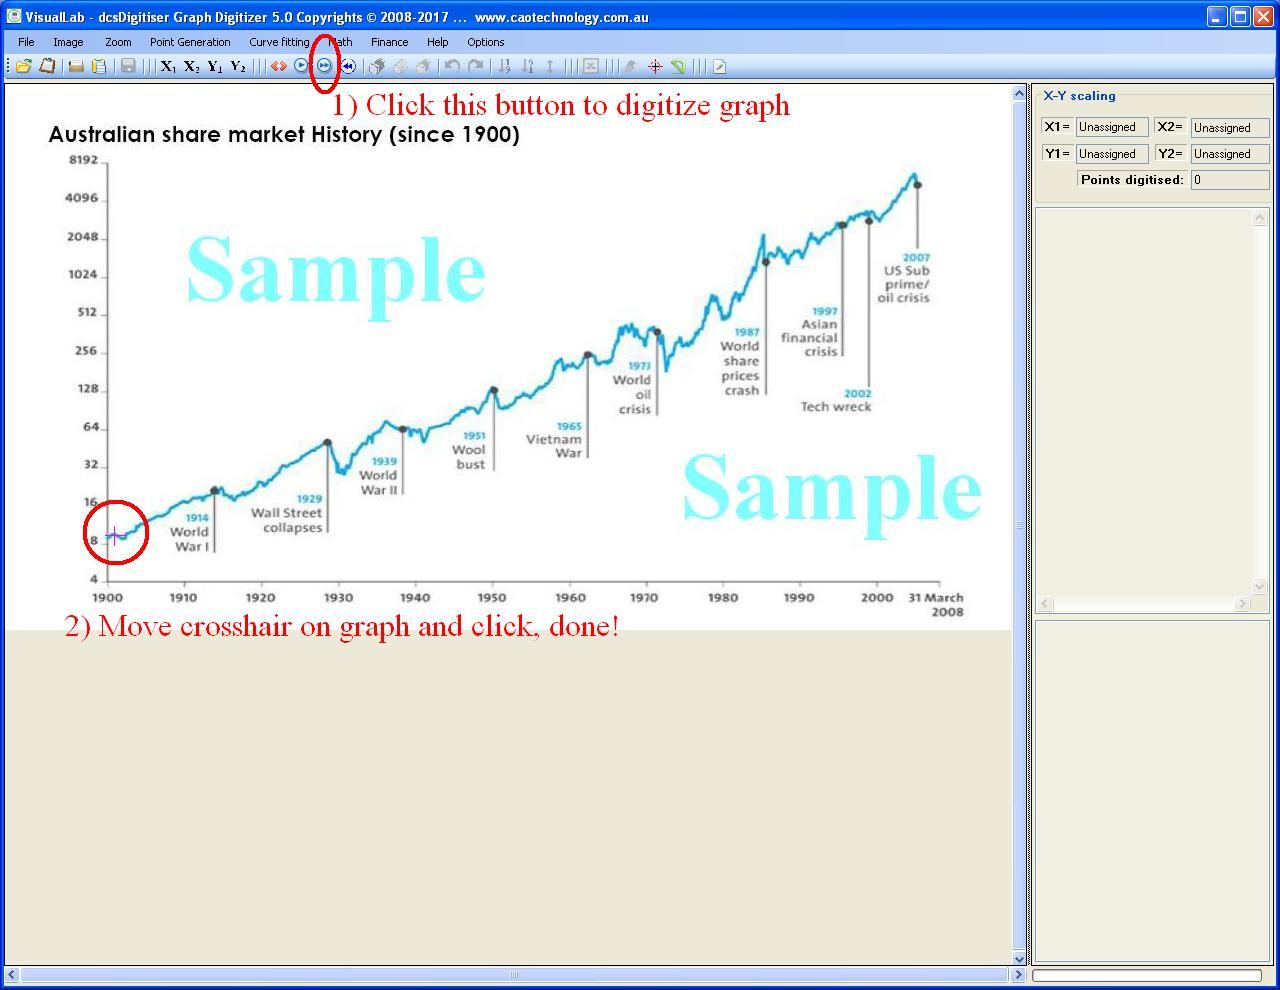
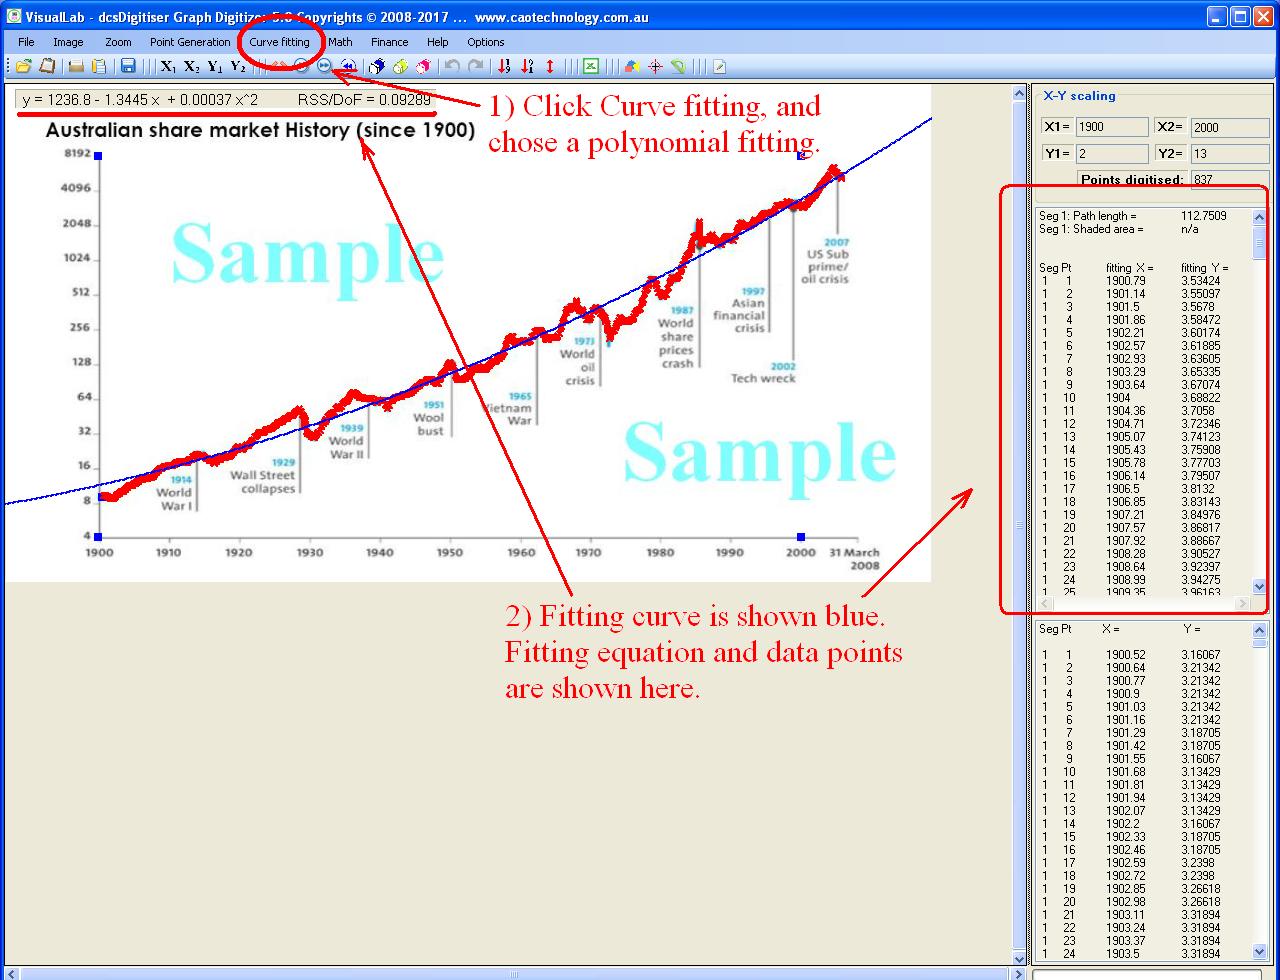
Example 1: To digitize a graph of Australian share market history, simply 1) click the digitizing tool button,
2) move crosshair over the graph and click.
To have a free trial of VisualLab, simply click Free trial
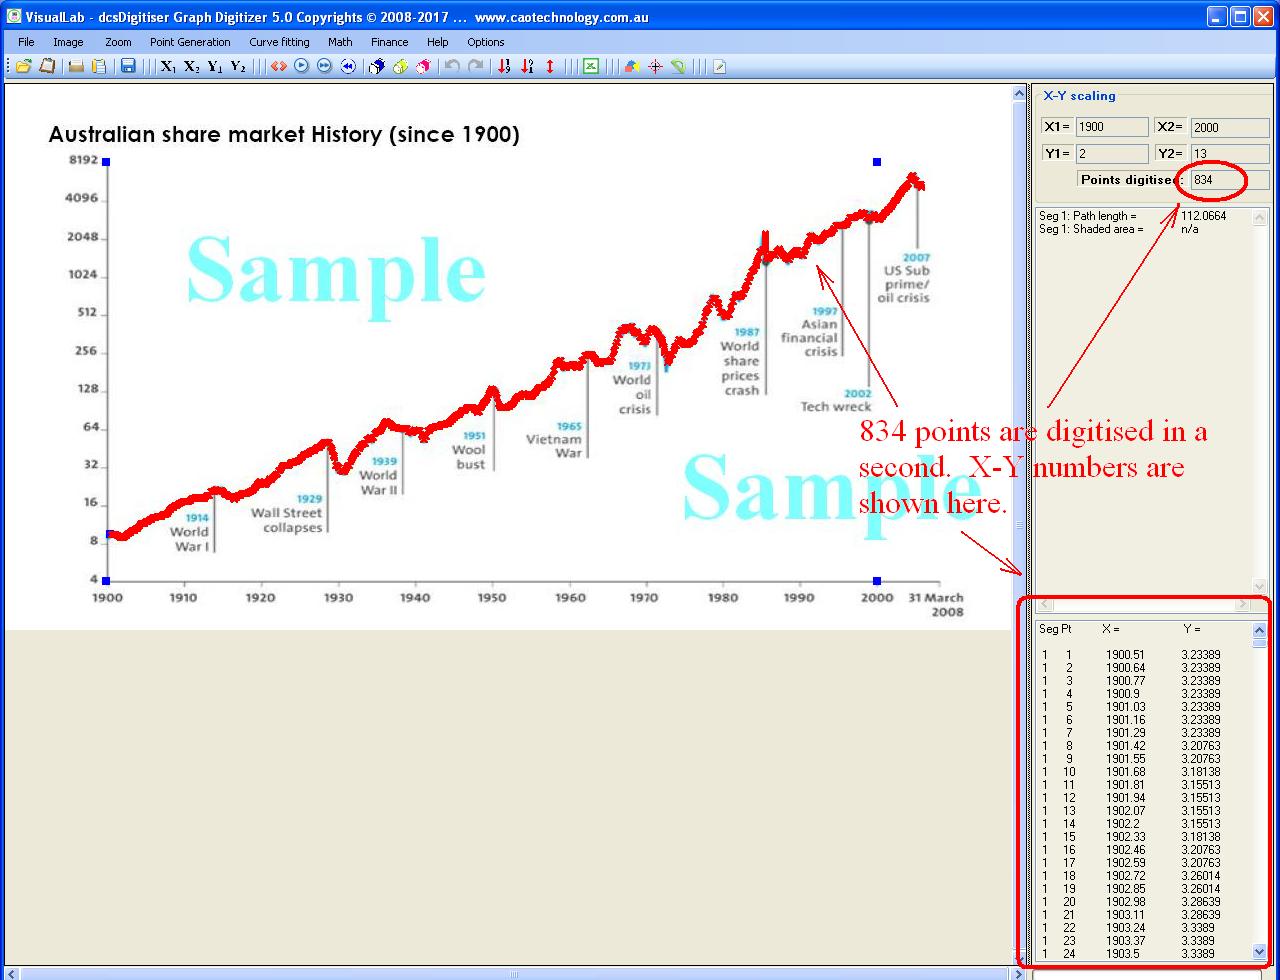
Example 2: The graph of Australian Share Market History is then automatically digitized to obtain 830 x-y numbers.
To have a free trial of VisualLab, simply click Free trial
Example 3: click Cruve fitting and chose a polynominal function, the digitized graph is curve fitted as shown
is the following figure.
To have a free trial of VisualLab, simply click Free trial
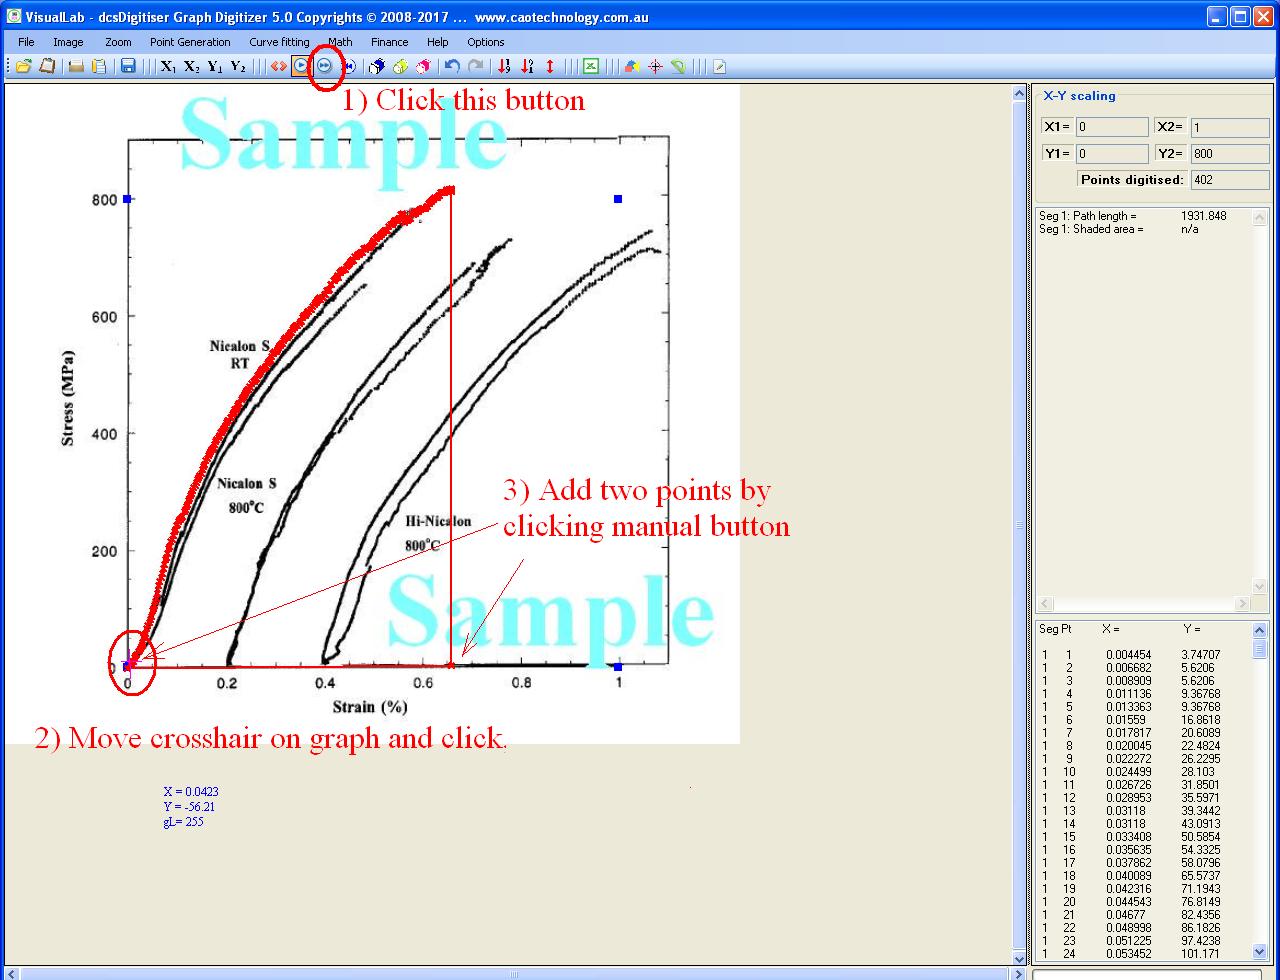
Example 4:
A strain-stress curve for mechanical testing of an alloy is simply digitized. To calculate the work for breaking
the testing specimen, two more points are added by clicking on the graph.
To have a free trial of VisualLab? simply click Free trial
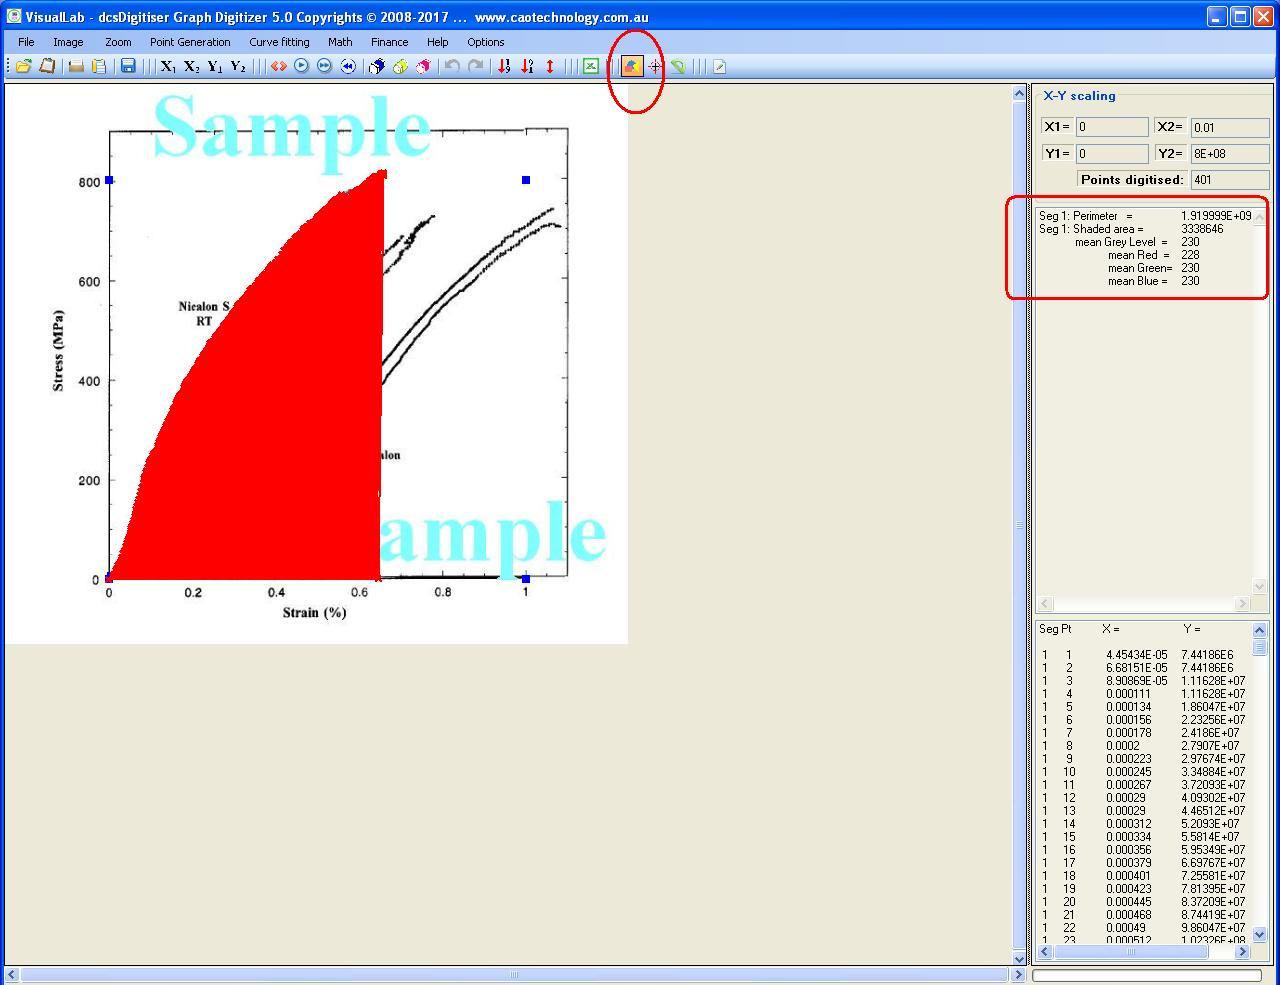
Example 5:
This button enables computation of the area size enclosed by all the points on the graph. Click it leading to calculation
of the work per volumn for breaking the specimen under testing, expressed as shaded area size, S,
which is 3.34 x 10⁶ J/m3. The breaking work can then be calculated as follows, given that the cross
section area, A, and initial specimen length, L0, are known:
W = A L0 S
To have a free trial of VisualLab, simply click Free trial
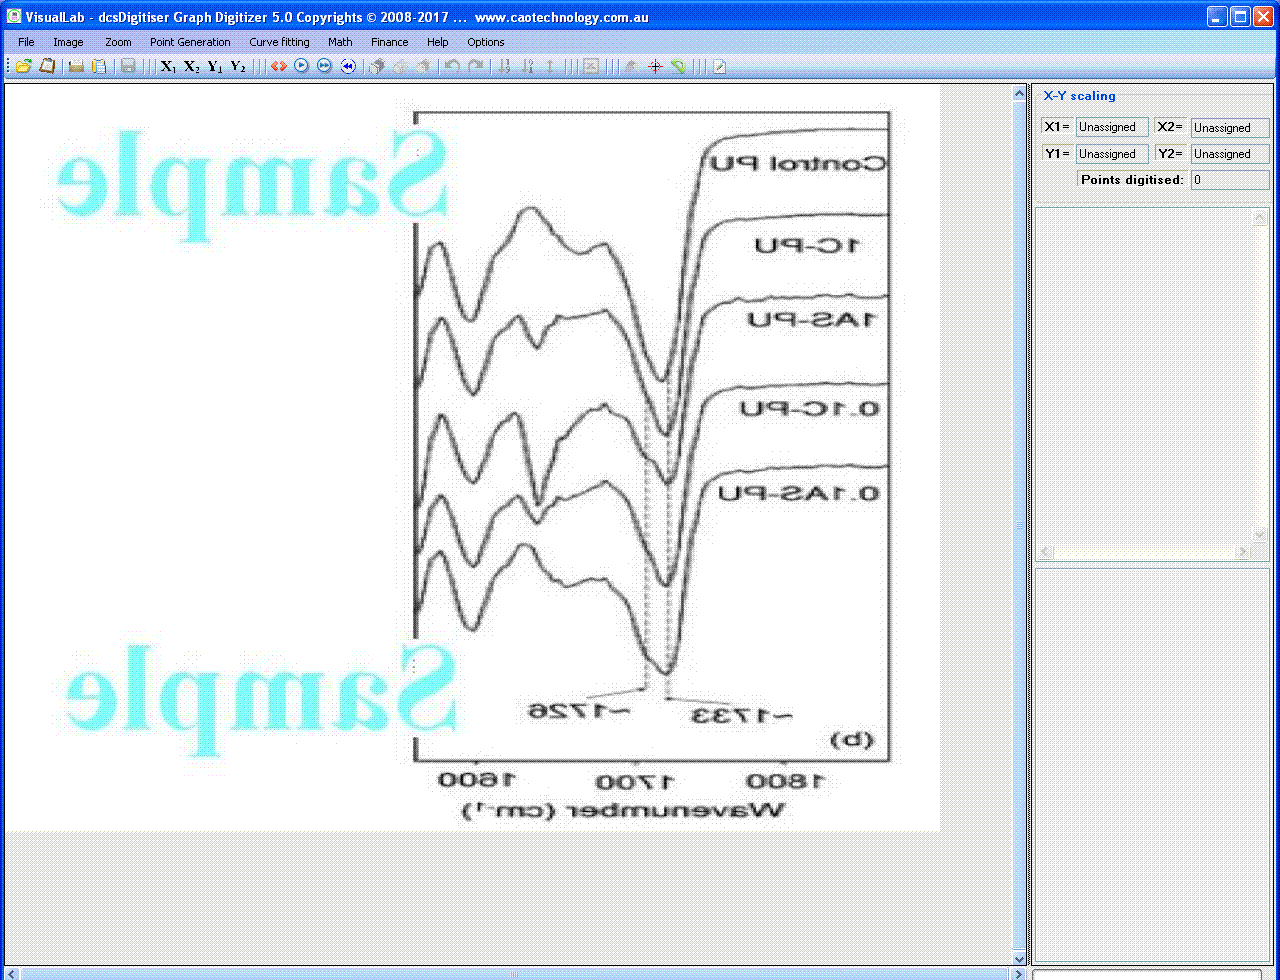
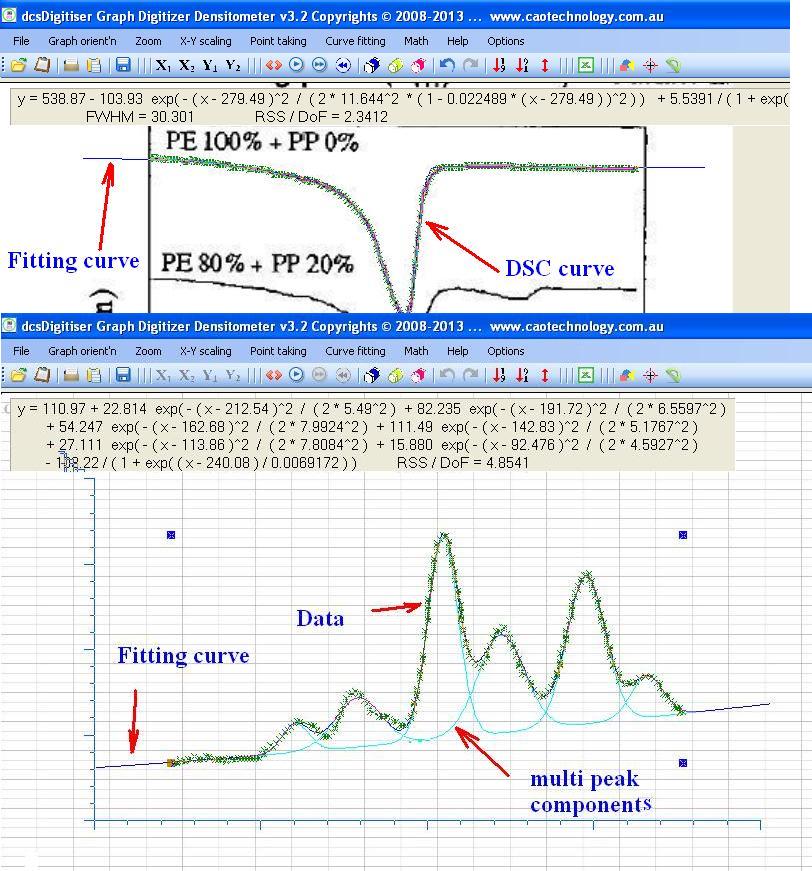
Example 6:
A single peak DSC curve is digitised and its equation is obtained by curving fitting; X-Y numbers of a multiple
peak curve is imported to VisualLab - dcsDigitiser, the curve is then fitted by curve fitting to obtain the eqution:
its multiple components are deconvoluted.
To have a free trial of VisualLab, simply click Free trial
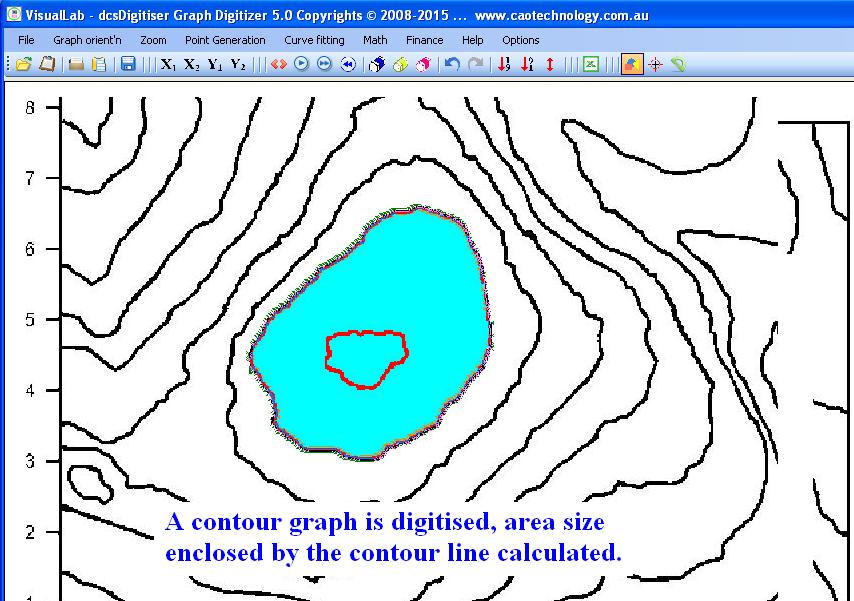
Example 7:
Simply by a few clicks, VisualLab-dcsDigitiser ditigises a contour line. The area size enclosed by the contour
line is then calculated by a click.
To have a free trial of VisualLab, simply click Free trial
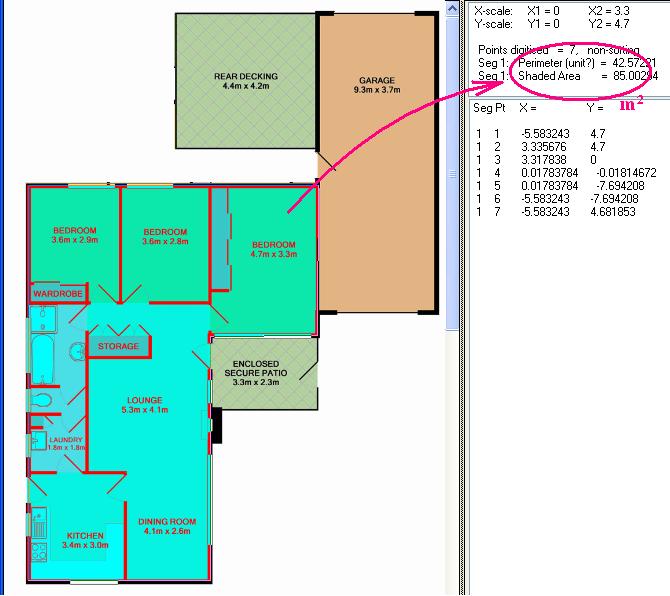
Example 8:
VisualLab digitizes a drawing with irregrular boundaries, and calculates the area size enclosed inside.
To have a free trial of VisualLab, simply click Free trial
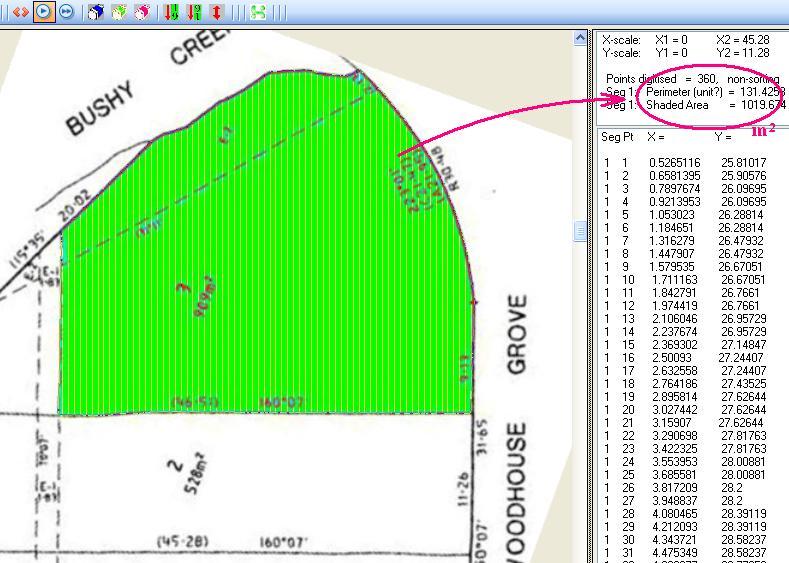
Example 9:
VisualLab measures the area size enclosed inside for a civic drawing of building plan.
To have a free trial of VisualLab, simply click Free trial
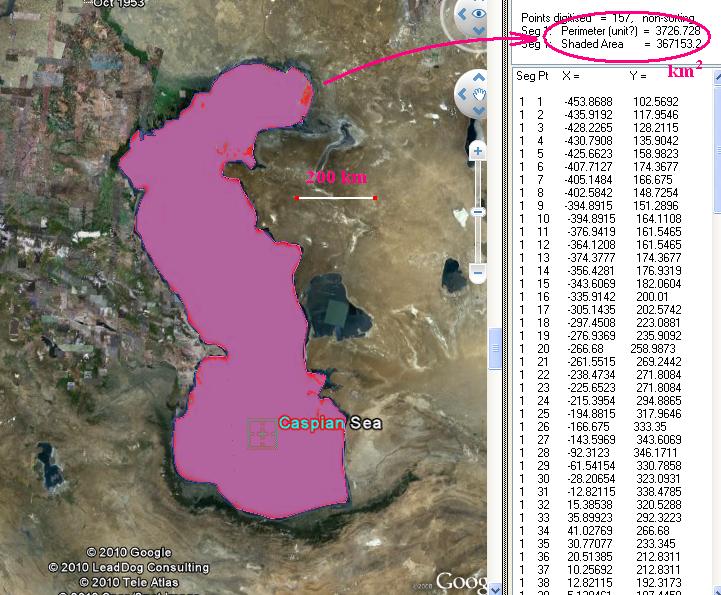
Example 10:
Google Earth satellite photo of the Caspian Sea was copied and pasted to dcsDigitiser, with a scale
bar of 200 km being attached. The coast line of the Caspian Sea was then manually clicked against the photo.
When the distance between the first-last points is close enough, dcsDigitiser automatically calculates the area
and perimeter of Caspian Sea, being around 367,153 km2 and 3,727 km, respectively (no curvature of the Earth
ground surface has been taken into consideration in this case).
To have a free trial of VisualLab, simply click Free trial
Example 11:
Formula 1 Qantas Australia Grand Prix car racing is held along the Albert Lake in Melbourne.
The lake's area size and circumference are: 510,598 m2 and 4842 m respectively.
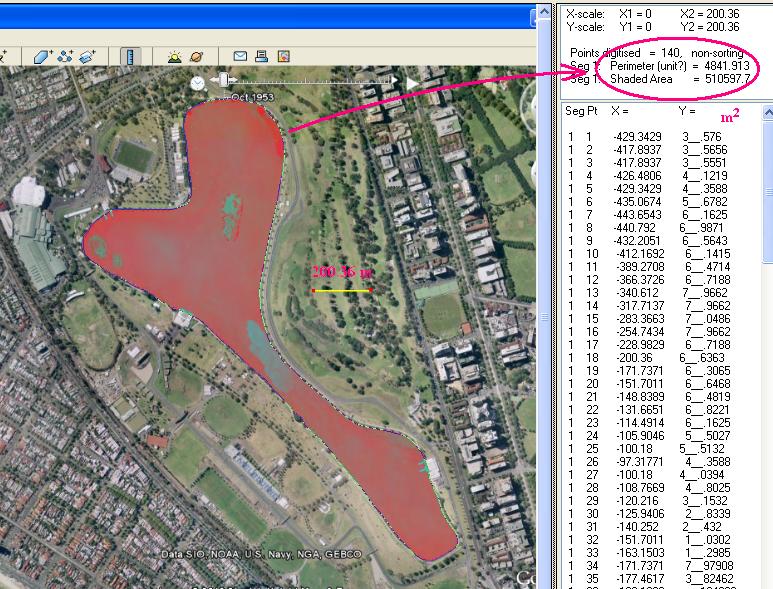
To have a free trial of VisualLab, simply click Free trial
Example 12:
VisualLab find the line with equal color for a contour graph.

To have a free trial of VisualLab, simply click Free trial
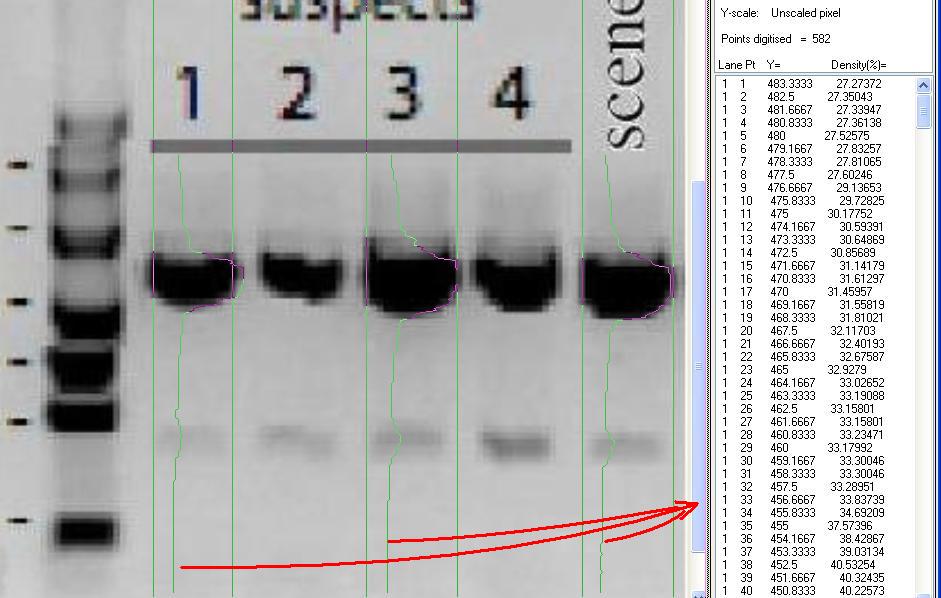
Example 13:
VisualLab - dcsDigitiser can be used for gel analysis as well: Both novelist Brown and historian Hart are interested
in reviewing the forensic records of Mr. Kennedy's assassination, and have the hair DNA testing results of 4 then
suspects in hand. Using dcsDigitiser, Brown and Hart digitized the hair DNA gel and obtained numerical density
profiles for peer analysis by their own eyes, which are often, though not always, sharper than that of CIA and FBI
detectives.
To have a free trial of VisualLab, simply click Free trial
To visit DSC Curve Solutions (DCS ®) and non-isothemal kinetics, click links shown in naviation bar.